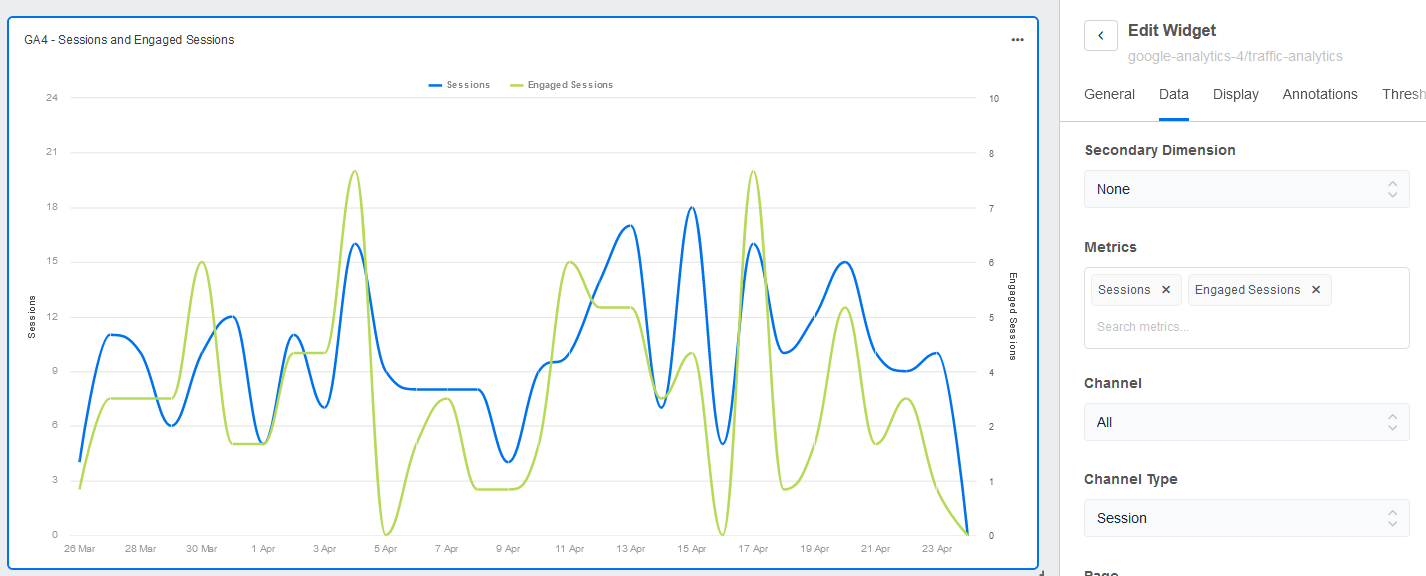
Are you looking to compare two different metrics in a single graph? We've got great news for you! Our latest update allows you to easily visualize two metrics simultaneously on bar, line, and area graph charts. This new feature streamlines the process of comparing data and deriving insights.
To use, simply open the "Data" tab when editing your widgets, and under "Metrics", select your second metric.